Bipolar Mood Chart – Guide to Track Stability and Wellness

Medically reviewed by Carolina Estevez, Psy.D Updated Date: February 8, 2026
Living with bipolar disorder can often feel like navigating a ship through unpredictable seas. One moment, the waters are calm, and the next, you are caught in a storm of mania or sinking into a trench of depression. For many, the key to finding a steady course isn’t just medication or therapy—it’s data.
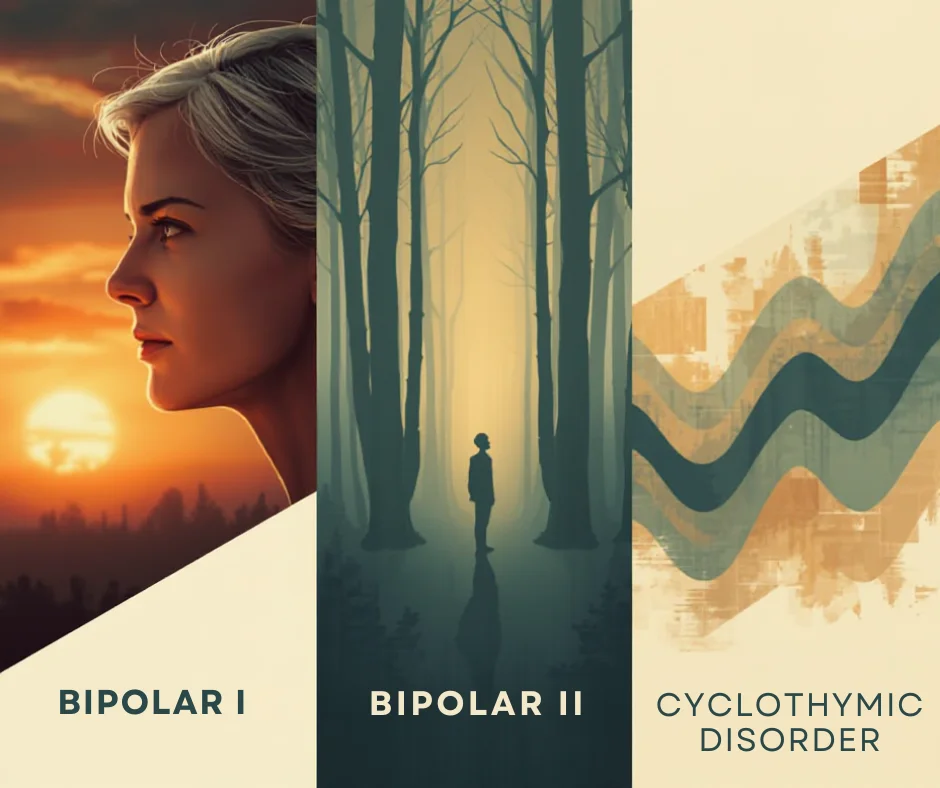
A bipolar mood chart is one of the most powerful, evidence-based tools available for managing Bipolar I, Bipolar II, and Cyclothymic disorders. By consistently recording your emotional states, sleep patterns, and triggers, you transform subjective feelings into objective insights.
In this comprehensive guide, we will explore everything you need to know about mood charting, how it improves clinical outcomes, and how to start your own today.
What is a Bipolar Mood Chart?
A bipolar mood chart (also known as a mood diary or life chart) is a visual or digital log used to track daily fluctuations in mood, energy, and behavior. Unlike a standard journal, which focuses on narrative thoughts, a mood chart focuses on metrics.
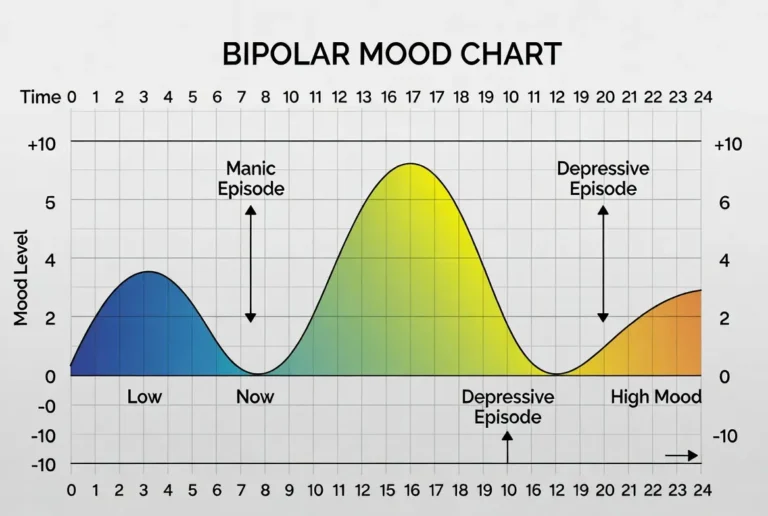
Typically, a chart asks you to rate your mood on a scale—ranging from severe depression to extreme mania—while also noting external factors that might influence those states.
The Core Components of a Mood Chart
- Mood Elevation/Depression Scale: Usually a numerical scale (e.g., -10 to +10).
- Sleep Duration: Hours of sleep per night (a primary indicator of an oncoming episode).
- Medication Adherence: Tracking whether you took your prescribed doses.
- Life Events: Stressors, conflicts, or significant achievements.
- Anxiety Levels: Often tracked separately as it can accompany both poles.
Why Use a Mood Chart? The Benefits of Tracking
Research consistently shows that patients who actively engage in “self-monitoring” have better long-term outcomes. Here is why:
1. Identifying Early Warning Signs (Prodromes)
Most bipolar episodes don’t happen overnight. They are preceded by “micro-shifts.” You might notice that for three days, you only slept five hours but felt “great.” On a chart, this sticks out as a red flag for mania. Detecting these shifts early allows you to contact your doctor and adjust treatment before a full-blown crisis occurs.
2. Improving Communication with Your Psychiatrist
When you see your doctor once a month, it’s hard to remember exactly how you felt three weeks ago. This is known as recall bias. A mood chart provides a clear, visual report that you can hand to your provider, leading to more accurate medication adjustments.
3. Seeing the “Big Picture”
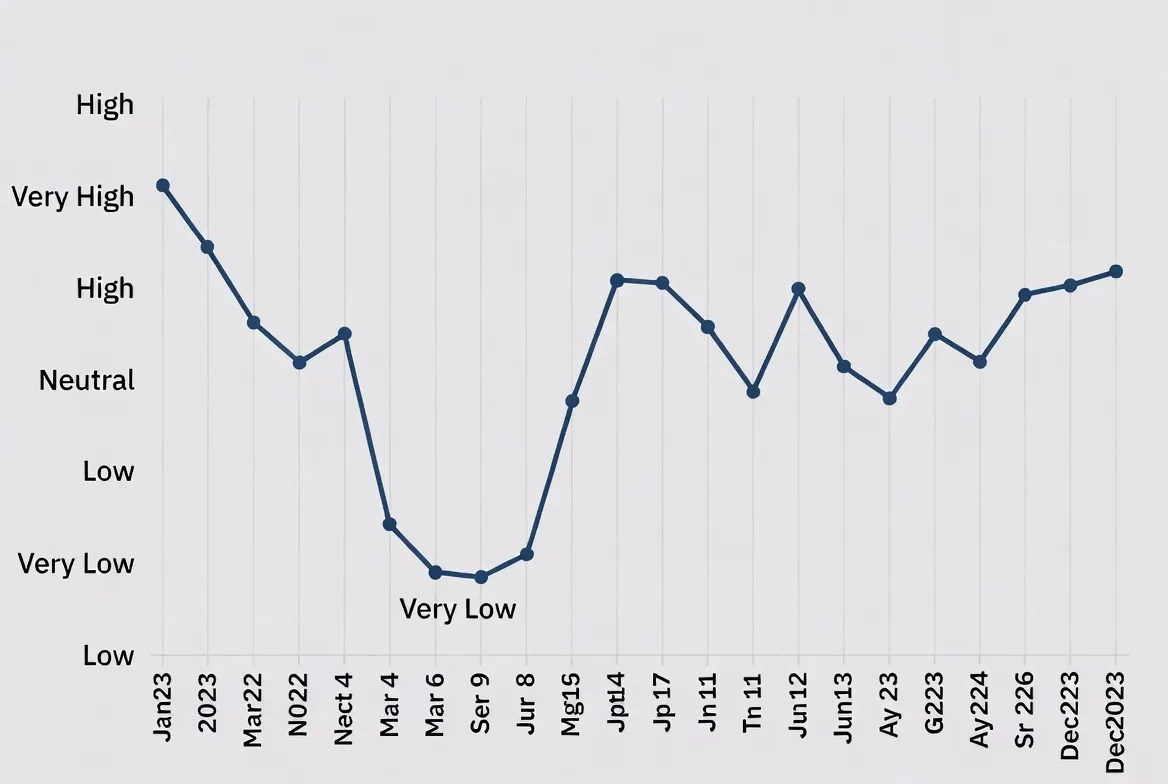
Bipolar disorder can make it feel like you are always in an episode. However, looking at a month-long chart might reveal that you actually had ten stable days. This can provide hope and a sense of agency over the illness.
How to Fill Out a Bipolar Mood Chart
Consistency is more important than complexity. Here is a step-by-step approach to effective charting:
Step 1: Define Your Scale
Most charts use a middle point of 0 to represent “Euthymia” (a stable, balanced mood).
- +1 to +3: Mild to moderate hypomania (increased energy, talkative).
- +4 to +5: Severe mania (loss of judgment, psychosis, high risk).
- -1 to -3: Mild to moderate depression (low energy, withdrawal).
- -4 to -5: Severe depression (suicidal ideation, inability to function).
Step 2: Track Sleep religiously
Sleep is the “canary in the coal mine” for bipolar disorder. A sudden drop in the need for sleep is the most common precursor to mania, while oversleeping often signals a depressive slide.
Step 3: Note Triggers and Lifestyle Factors
Did you have an extra cup of coffee? Did you stay up late for a party? Did you argue with a spouse? Note these alongside your mood to see if patterns emerge.
Digital vs. Paper: Which is Better?
| Feature | Paper Charts | Digital Apps (e.g., Daylio, eMoods) |
| Privacy | High (physical) | Depends on app security |
| Ease of Use | Requires manual entry | Reminders and “one-tap” entry |
| Data Analysis | Manual | Automatic graphs and reports |
| Customization | Unlimited | Limited to app features |
Printable Bipolar Mood Charts (Paper)
For many, the act of physically writing down their mood is more therapeutic than tapping a screen. A free printable bipolar mood chart is a fantastic way to start without any technical barriers.
Why Use a Bipolar Mood Chart?
Using a mood chart for bipolar pdf offers a high level of privacy. There are no data concerns or “cloud” storage issues. Furthermore, many patients find it easier to bring a piece of paper into a therapy session than to scroll through an app.
Where to Find Them
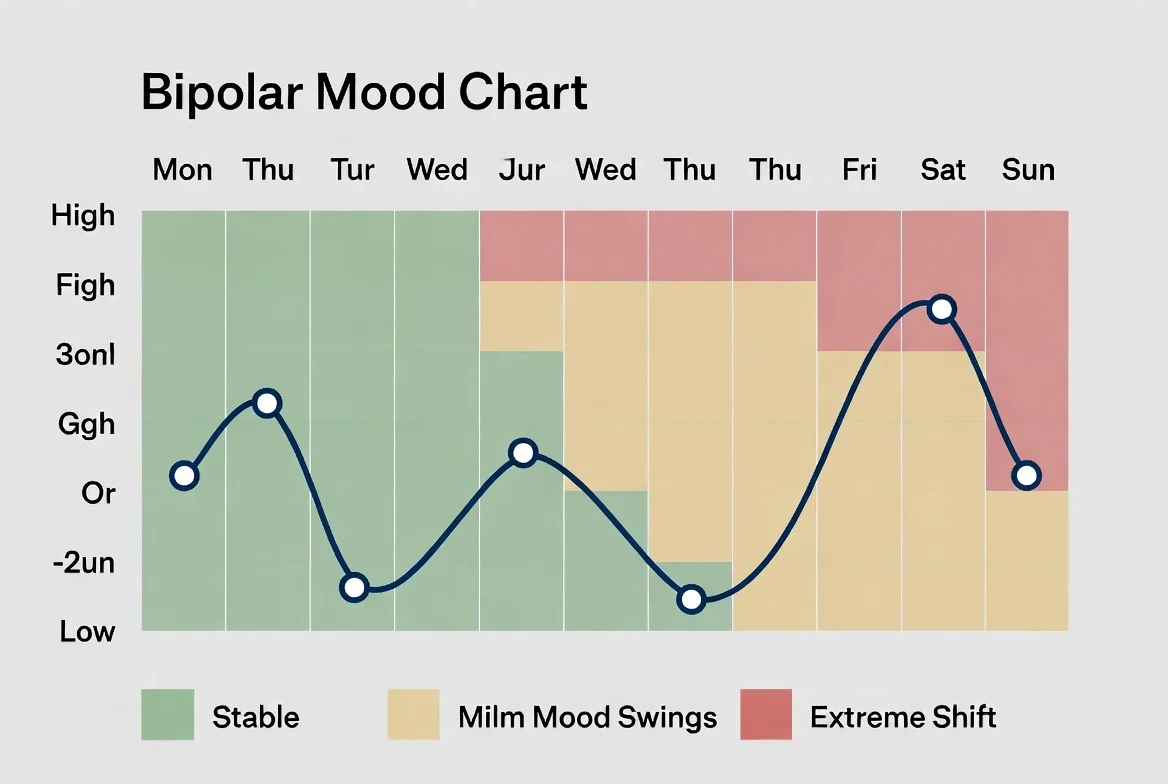
You can easily find a printable bipolar mood chart or a mood chart for adults pdf online from reputable organizations like NAMI or the DBSA. These are often designed in a weekly format, allowing you to see a snapshot of your stability at a glance. If you prefer a more general approach, searching for a mood tracker pdf will yield various artistic designs that make tracking feel like a creative habit rather than a clinical chore.
Bipolar Mood Chart Templates
If you are tech-savvy but want something more personal than a standard app, a bipolar mood chart template in Excel or Google Sheets might be your best bet.
The Benefits of a Bipolar Mood Chart Excel
A bipolar mood tracking sheet built in Excel allows you to generate your own graphs automatically. You can add custom columns for things that are unique to you—perhaps you want to track the impact of your exercise routine or your “brain fog” levels.
Using a New Bipolar Mood Chart
When starting a new bipolar mood chart, the goal is consistency. Whether you use a high-tech sheet or a simple bipolar mood tracking sheet on your nightstand, the most important rule is to log your data at the same time every day—usually right before bed.
Online & App-Based Bipolar Mood Trackers
While paper is classic, the digital age has brought a level of convenience that makes managing bipolar much more sustainable for the average person. A bipolar mood chart app offers something a PDF cannot: automated alerts, data analysis, and easy sharing with your clinical team.
eMoods Bipolar Mood Tracker
If you search for a free bipolar mood tracker, the eMoods bipolar mood tracker is widely considered the gold standard. Unlike general mood apps that focus on “happiness,” eMoods was designed specifically for the complexities of bipolar disorder.
- Features: It tracks the four pillars of bipolar stability: depressed, elevated (hypomanic/manic), irritable, and anxious.
- Privacy: It is built with high privacy standards, storing data locally on your device.
- Who it’s best for: Patients who need a “no-nonsense,” clinical-style tool that can generate a bipolar mood chart free of charge to email to their doctor.
Other Notable Apps
Other popular choices include Daylio, which is highly visual and uses icons, making it a great bipolar mood tracker app for those who find typing out symptoms too exhausting during a depressive episode.
Comparing Paper vs. App Mood Tracking
Choosing between a bipolar mood tracker in your hand or one on your phone depends on your lifestyle and your privacy needs.
| Feature | Paper Charts / PDFs | App-Based Trackers |
| Accessibility | Requires carrying a folder/book | Always in your pocket |
| Data Visualization | You must draw the lines manually | Automatic graphs and trends |
| Reminders | None (requires discipline) | Push notifications to log data |
| Privacy | High (physical lock and key) | Varies (check app encryption) |
| Clinician Sharing | Hand a physical sheet over | Export a PDF or CSV report |
For many, a mood tracker app is the winner for long-term consistency, but a mood chart for adults pdf is often better during initial diagnostic phases where a doctor needs to see raw, handwritten notes.
Specialized Bipolar Mood Charts
In some cases, a standard chart isn’t enough. There are specialized versions designed to track specific, high-risk behaviors or to follow established clinical models.
Tracking Irritability and Safety
A violence bipolar mood chart or an “agitation tracker” is sometimes used in inpatient settings or for patients who experience “dysphoric mania.” This focuses heavily on the “irritable” pole, helping to identify triggers for aggression before they escalate. Disclaimer: These charts should always be managed under the strict supervision of a clinician or safety officer.
The Black Dog Institute Model
The bipolar mood chart black dog institute version is a famous clinical resource. It focuses heavily on “Life Charting,” which looks at how significant life events—like a job loss or a birth—correlate with mood shifts over a long period (years rather than months).
How to Use a Bipolar Mood Chart Effectively
Simply having a bipolar mood tracking sheet isn’t enough; you have to use it correctly to see results. The goal of a daily bipolar mood chart is to provide a “trough” of data that your doctor can use to save your life.
- Log at the same time: Pick a time (like 9:00 PM) to reflect on the day.
- Rate your “Peak” and “Trough”: Don’t just rate how you feel now. Rate the highest high and the lowest low you experienced in the last 24 hours.
- Be honest about meds: If you missed a dose, mark it down. Your doctor needs to know if a “dip” in mood was caused by a missed pill or a failure of the medication itself.
- Don’t over-analyze: Spend no more than 2-3 minutes on it. If it becomes a chore, you will stop doing it.
Bipolar Mood Charts & Bipolar Types
Your chart will look different depending on what is the difference between bipolar 1 and 2.
- In Bipolar I: Your chart may show spikes that go “off the charts” (+5 or +10), indicating full mania. You might also note psychotic features or hospitalizations.
- In Bipolar II: Your chart will likely spend more time in the “negative” range (depression). The highs will be “hypomanic” (+1 to +3), which are often harder to spot because they feel like high productivity.
Mood Color Charts vs. Clinical Mood Charts
This is a point of significant confusion online. Many people search for a mood ring color chart or a mood necklace chart thinking it is a psychological tool. It is important to clarify: these are novelty items, not medical devices.
Novelty “Mood” Colors
A mood ring color meaning chart usually claims that “blue means relaxed” and “black means stressed.” These rings work based on thermochromic elements—they react to your body temperature, not your actual brain chemistry. While a mood necklace colors meanings chart or mood bead color chart can be a fun way to practice “emotional check-ins” with children, they have no clinical validity for diagnosing or managing bipolar disorder.
The Dangers of Misinterpretation
An eye color mood chart or a dolphin mood ring color chart might be interesting for entertainment, but they should never be used to guide medication or therapy. If you want to use colours and moods chart principles in therapy, consider using “Color-Coded Mood Tracking” in your bipolar mood tracking sheet (e.g., coloring a day blue for depression and yellow for hypomania). This is a valid way to visualize your mood color chart meanings in a clinical context.
Using Mood Charts With Therapy & Psychiatry
A bipolar mood chart is not just a personal diary; it is a clinical bridge between you and your healthcare team. In psychiatry, we often face “recall bias,” where a patient might only remember the last three days of their month rather than the full four weeks. By bringing a bipolar mood tracker to your appointments, you provide a high-definition map of your brain’s activity.
Improving Medication Adjustments
When you share your chart, your psychiatrist can see the exact correlation between a dosage change and your stability. For example, if you started a new mood stabilizer on the 10th and your daily bipolar mood chart shows a decrease in “racing thoughts” by the 17th, it confirms the treatment’s efficacy. Conversely, it can catch when an antidepressant is accidentally triggering a “switch” into hypomania.
Therapy Integration
In therapy, a bipolar mood tracking sheet helps you and your counselor identify cognitive triggers. If every “low” on your chart is preceded by a conflict at work or a night of poor sleep, you can focus your sessions on developing specific coping mechanisms for those exact stressors.
Frequently Asked Questions (FAQ)
What is a bipolar mood chart?
A bipolar mood chart is a systematic log used to track daily changes in mood, sleep, medication adherence, and life events. It is a tool used to help identify patterns and early warning signs of manic or depressive episodes.
Are bipolar mood charts accurate?
While they rely on self-reporting, research shows they are highly reliable for tracking depressive symptoms and sleep patterns. They are considered more accurate than a patient’s memory during a monthly clinical interview.
Should I use a PDF or an app?
This depends on your preference. A bipolar mood chart pdf offers total privacy and a tactile experience, while a bipolar mood tracker app provides automated graphs, reminders, and easy data sharing.
How long should I track my mood?
To see meaningful patterns—such as seasonal shifts or the long-term impact of a medication—most clinicians recommend tracking for at least 3 to 6 months.
Can a mood chart diagnose bipolar disorder?
No. A mood chart is a data-collection tool, not a diagnostic one. Only a licensed mental health professional can provide a formal diagnosis based on clinical criteria like the DSM-5.
Related Mental Health Context: Mood in Literature
It is worth noting that the term “mood” has a different meaning outside of a clinical setting. In your research, you may come across the question: what is a mood in a poem?
In literature, “mood” refers to the atmosphere or emotional “landscape” a writer creates to evoke feelings in the reader—such as a “gloomy” or “whimsical” setting. While a mood tracker in psychiatry measures a person’s internal biological state, a mood in literature is an external artistic choice. Understanding this distinction helps avoid confusion when searching for “mood charts” online, as some results may lead to literary analysis rather than mental health support.
Conclusion & Medical Disclaimer
A bipolar mood chart is more than just a list of numbers; it is a testament to your commitment to stability. By taking two minutes each day to fill out a mood tracker, you move from being a passive observer of your illness to an active manager of your wellness. Whether you use a free printable bipolar mood chart or a sophisticated bipolar mood tracker app, the data you collect is a powerful weapon against the unpredictability of the disorder.
Empower yourself, inform your doctor, and use these tools to build a more predictable, fulfilling life.
Authoritative References & Resources
- National Institute of Mental Health (NIMH): Life Charting Manual
- Black Dog Institute: Daily Mood Chart Resources
- Journal of Clinical Psychiatry: Electronic vs. Paper Mood Tracking
- Bipolar UK: The Mood Scale and Tracking Guide
- Mayo Clinic: Bipolar Disorder Management


Subscribe to Our Newsletter
Get mental health tips, updates, and resources delivered to your inbox.
MORE from Author
Read More In my practice as a clinical psychologist, I often observe that the difference between a patient who crumbles under pressure…
 We all have "up" days and "down" days. Perhaps you feel energized after a promotion or sluggish on a rainy…
 To define bipolar disorder accurately, we must look at it as a chronic mood dysregulation condition. In psychology and medicine,…
 To answer whether bipolar fits the bill, we first have to define what a neurodivergent person actually is. The term…
Are you looking for a Therapist?
Connect with qualified mental health professionals who understand
bipolar disorder, mood changes, and emotional challenges.
Private • Supportive • Confidential